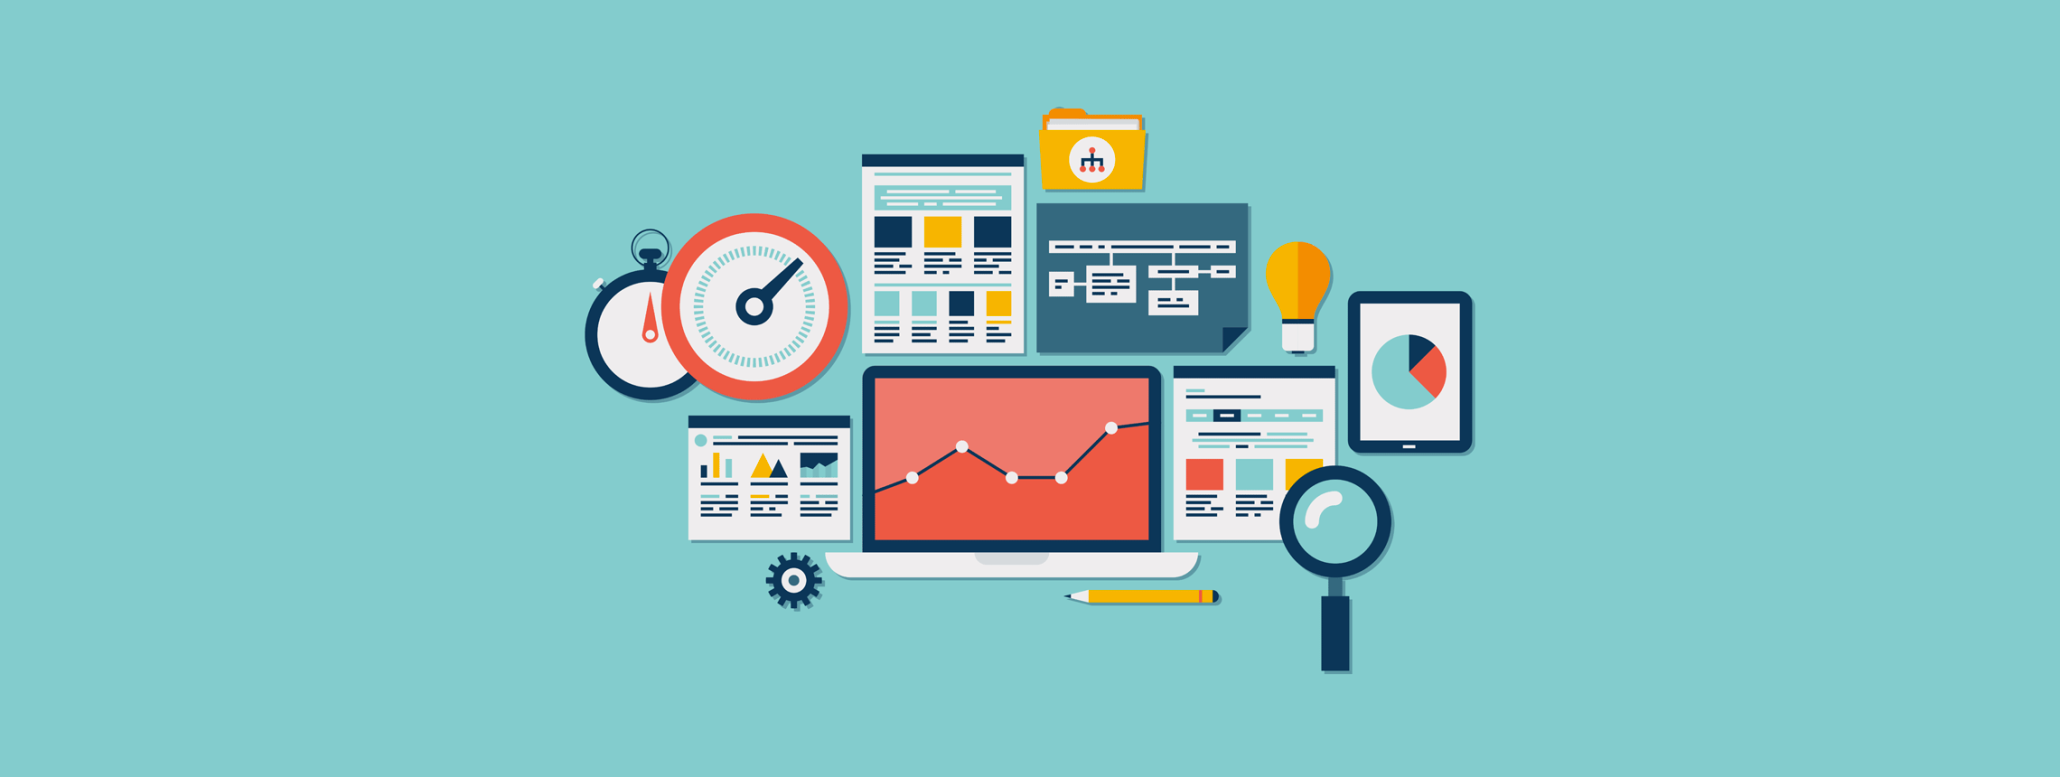
Illustration of the tools at play in Web Analytics
In my first story ‘User Experience is …’ I promised that …
"over the course of a few stories, I’ll try and cover a few of the sciences we draw upon in our art as a creative community to create engaging experiences."
And in my last story I talked around how Experience is … Behavioural Economics. This time we venture out into the world of insight and analytics.
Illustration of the tools at play in Web Analytics
Being a UX designer, it’s good to know what users are doing, where they are coming from, how long they are engaged, where they go next, to understand the ways you can improve conversion or highlight what’s missing.
And when I say designer, I’m only using that job title as an example. Thinking wider anyone has the capability of being curious or a natural problem solver, so for these types of people, web analytics maybe interesting but also the source of answers to many questions why.
Web analytics and usage statistics provide quantitive insight into who, when, where and how your product is being used; only providing part of the bigger insight picture. Meaningful behavioural insights can be more difficult to get to and analytics is probably not the right method for attitudinal insight. So you can get so far with analytics data, but when teamed with more moderated qualitative user research (where you can get more behavioural and attitudinal insight) it can provide a very compelling picture of your product.
I’ve found a massive benefit of having analytics integrated into products and becoming core to sprint reviews to guide conversations around value and measures of success. Not only for the continuing life of the product, but also when I introduce new features or refine existing ones.
When I review analytics within sprint reviews, I might monitor what is and isn’t being used, so what users are engaging with and what they choosing not to.
Analytics is useful to stretch out continuing influence on a product. It continues the feedback loop that was started from the design iterations to within the live product. Allowing further refinement to the product, as part of continuous inspection and improvement. This leaves the product in good health and ensures that the value discovered in lean canvases is continually tracked, realised and celebrated.
We’ve used them to bring problems or opportunities to life working with product owners to tell a story back to the business to improve understanding. They have worked in product teams to:
The data that comes from website analytics software is not subjective in the same way that design or qualitative data often is. Everyone has an opinion, that they feel is just as valid as anyone else, so feels like they can also be a designer. Having a clear rationale and following principals, can break down the subjectivity of design, but the silver bullet is having data behind a design.
While qualitative research are open to interruption, biases and participant leading, the metrics used in website analytics are more black and white. This leads to fewer arguments about the findings.
As this quantitate data is definitive it also makes it perfect for measuring the impact of changes. If a design solution to a problem is implemented then it can be measured by analysing the changes in user behaviour before and after the change was made. This makes it easier to prove your point and show the value of your work.
Using analytics can often give an almost instant answer to a question. Other user research and methods can take days or weeks to see results but with quantitative data it can just be a case of querying the data in the right way. This provides a reasonably good overview of user behaviour, which given more time can be supplemented with other research techniques.
Analytics provide a view over the lifetime of a product; other research methods might only show a snapshot for a particular period of time. Analysing data that has been consistently collected over time gives much more insight than ‘one-off’ studies. But also the sheer breath of interaction and behaviour that can be analysed is beneficial (if boggling when you first start!).
The analysis of analytics fits easily into the design process, no matter which one your following. Data sourced from your analytics can pinpoint problem areas, which can then become a focus for usability testing, heuristic assessments or other qualitative research.
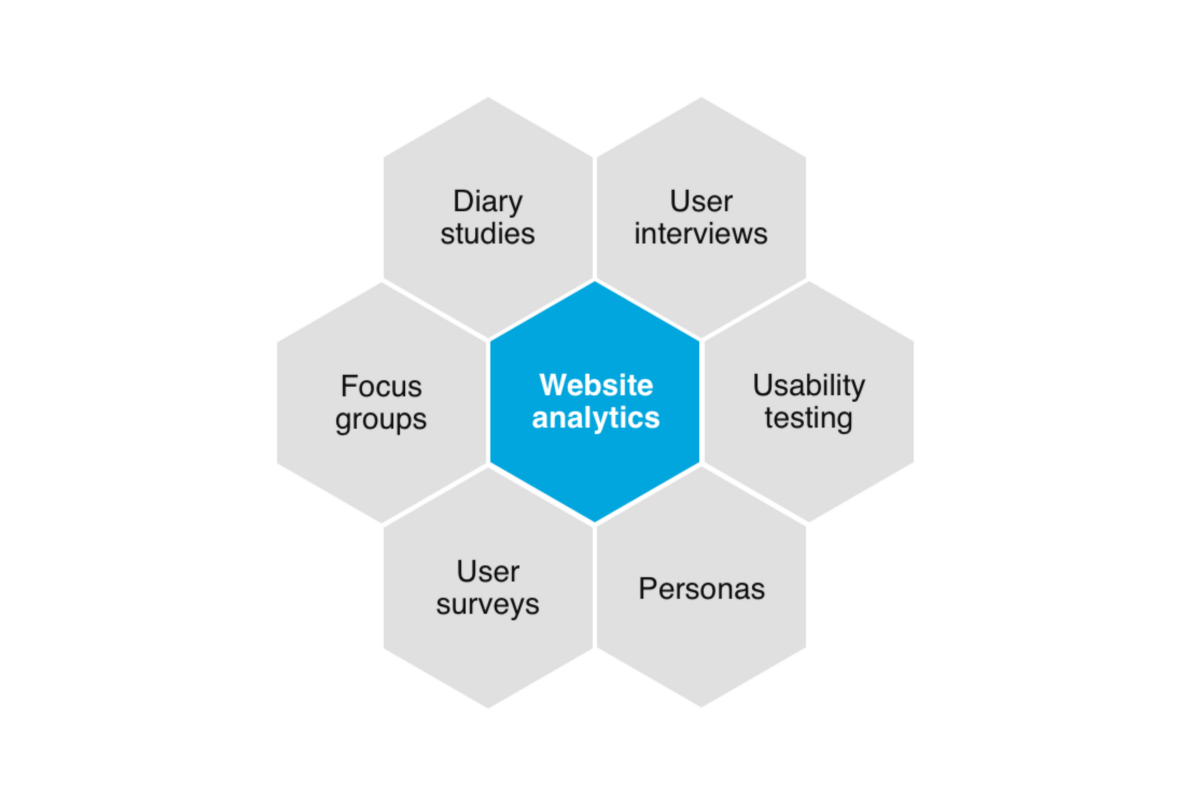
Web analytics honeycomb showing where analytics fits into other user research methods
Demographics helps to build up context of use in it’s output as well as supporting to creation of personas and providing participant recruitment for moderated qualitative research.
It also helps that presenting findings from analytics data is easy and naturally fits into presentations! Particularly useful when demonstrating the ROI of UX. Let’s face it stakeholders love a good powerpoint presentation, especially when it contains a graph!
But let’s not forget, analytics has it’s place within the wider spectrum of moderated and unmoderated quantitate and qualitative research and insight and should be used to answer the right questions, in the right place, in the right way.
So there’s a quick skip through insight and analytics. I’m going to dip my toe into how User Experience is … Product Ownership next.
Originally written as part of the ‘User Experience is …’ series for UX Collective.